Imagine starting your week without exporting, VLOOKUPing, and apologizing to stakeholders for broken charts. That’s the promise of marketing reporting automation tools: less grunt work, more strategic focus, and reports people actually read.
But here’s the catch — “automation” can mean anything from a scheduled Looker Studio refresh to an AI that summarizes your GA4, Google Ads, and Meta Ads data into a podcast you can listen to on your commute. In this guide, we’ll map the landscape, show what’s actually worth automating, and help you pick the right setup for your team, from scrappy startup to multi-brand enterprise.
What counts as “marketing reporting automation” in 2025?
In plain terms: software that pulls your data, transforms it into useful metrics, and delivers the insights in a repeatable, reliable way with minimal human effort. The best marketing reporting automation tools do four things well:
- Connect to the source of truth (GA4, Google Ads, Meta Ads, Search Console, CRM).
- Normalize and model data so metrics align and apples compare to apples.
- Visualize and narrate results for different audiences (analysts, execs, clients).
- Trigger workflows: alerts, recommendations, and action items.
Bonus points if they add AI to interpret what happened and explain what to do next. Gartner calls this augmented analytics — making analytics more accessible via automation and natural language.
Who actually needs automation (and who doesn’t)?
If your weekly report is a single spreadsheet, a one-click refresh might be enough. But most teams end up with cross-channel complexity: paid search, paid social, SEO, email, and a CRM pipeline that refuses to line up neatly with ad clicks. That’s when automation becomes less “nice to have” and more “we like our sanity.”
Signals you’re ready
- You’re merging GA4 traffic with paid media and CRM in every report.
- Attribution debates are eating meeting time.
- Stakeholders want an executive TL;DR, not a 30-slide deck.
- You repeat the same commentary each week.
- Someone built a fragile spreadsheet that no one dares to touch.
The layers of a modern reporting stack
Before evaluating marketing reporting automation tools, it helps to know the layers they cover:
- Data connectors: Pull raw data from GA4, Google Ads, Meta Ads, Search Console, LinkedIn Ads, etc.
- Storage/modeling: Data warehouses and transformations (BigQuery, Snowflake, dbt), or simpler in-app modeling for non-technical teams.
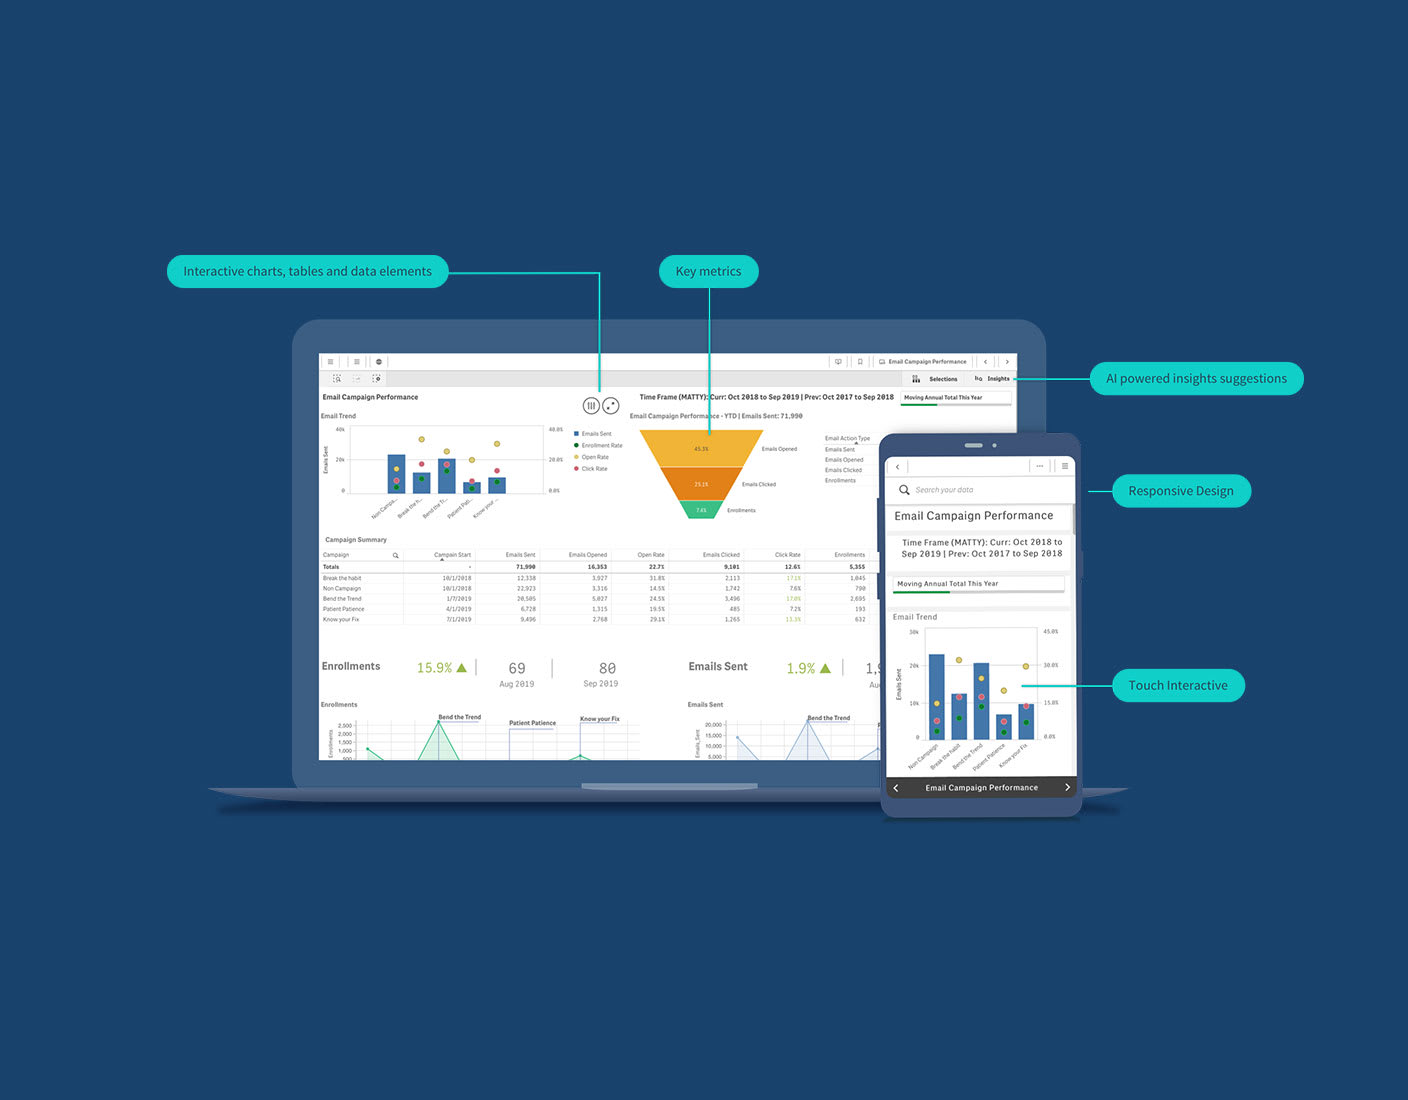
- Visualization/reporting: Dashboards and slides (Looker Studio, Tableau) or purpose-built marketing dashboards.
- AI/insight layer: Narrative summaries, anomaly detection, recommendations, audio/video recaps.
- Delivery and workflow: Scheduled emails, Slack digests, stakeholder views, client-ready exports.
Most teams don’t want to assemble all of this themselves. That’s why the market has moved toward bundled solutions that combine connectors, modeling, and automated narratives.
What to automate (and what to keep human)
Automate these
- Data pulling and normalization: Channel names, campaign tags, and date fields should just work across sources.
- Recurring KPI calculation: CAC, ROAS, MER, blended CPA, funnel conversion by channel, cohort retention.
- Recurring reporting cadence: Weekly roll-ups, monthly executive summaries, client-ready PDFs.
- Alerts and anomaly detection: When spend spikes or conversions drop, you shouldn’t be the smoke alarm. See our GA4 anomaly detection guide.
- Cross-channel trend analysis: Automatically highlight material changes with context.
Keep these human (with AI assist)
- Budget tradeoffs: AI can suggest reallocations, but you own the context: seasonality, pipeline health, brand goals.
- Hypotheses and experiments: Machines surface patterns; marketers design the tests.
- Storytelling for execs: Use AI to draft, but edit for strategy and tone. For help, here’s how to communicate insights to executives.
The decision framework: pick the right tool for your team
Choosing marketing reporting automation tools is easier when you score options on five criteria:
- Coverage — Does it connect to your core channels plus CRM? Can it handle UTM chaos and naming conventions?
- Time-to-value — How long from signup to a trusted weekly report? Hours, days, or months?
- Insight quality — Does it surface meaningful trends and suggestions, or just pretty charts?
- Audience fit — Analysts, execs, clients — do they each get what they need without extra work?
- Total cost of ownership — Licenses, connectors, warehouse fees, and the hidden cost: your team’s time.
Starter stack (early-stage and lean teams)
You need a fast, opinionated system that reduces configuration. Look for:
- Native connectors to GA4, Google Ads, Meta Ads, Search Console.
- Prebuilt KPIs for acquisition, engagement, and conversion.
- Automated weekly summaries and audio/video recaps.
- Light customization without needing SQL.
Related reading: weekly marketing report template, marketing dashboard examples.
Scaling stack (growth-stage and agencies)
You need client-ready views, cross-account rollups, and workflow automation:
- Multi-account management and white-label options for agencies.
- Automated commentary by client or brand.
- Anomaly detection across portfolios.
- Stakeholder-specific dashboards: CMO summary, channel manager deep dives.
Related reading: client reporting for marketing agencies, executive dashboards.
Advanced stack (data teams in the loop)
You want your warehouse and models but still need automated narratives and distribution:
- Warehouse-native models (BigQuery/Snowflake) or reverse ETL support.
- dbt-friendly transformations and unified taxonomy management.
- AI summaries over governed metrics.
- APIs and webhooks to push insights into Slack/Jira.
Related reading: cross-channel dashboard guide, marketing KPI framework.
Key features to demand in 2025
1) Unified channel taxonomy and modeling
Your Google Ads “Brand | US | Exact” shouldn’t become “unknown campaign” the moment it hits a dashboard. Look for tools that auto-clean UTMs, harmonize naming, and let you define channel groupings once. Google’s guidance on GA4 channel groupings is a helpful baseline (GA4 Default Channel Grouping).
2) AI narratives and action recommendations
Charts tell you what; AI should tell you so what. The best systems generate human-sounding summaries, call out materially significant changes, and suggest next steps (raise caps on high ROAS ad sets, pause non-converting keywords, check landing page speed).
3) True cross-channel visibility
You want blended metrics (MER, blended CPA) and per-channel KPIs in one view, with the ability to drill. If you’re juggling paid + organic + email + partner, a single source of truth is non-negotiable. Start with our cross-channel dashboard guide.
4) Anomaly detection you can trust
Not every dip is a disaster. Good systems use seasonality and thresholds to reduce alert fatigue — see how anomaly detection works with GA4.
5) Executive-ready summaries
Stakeholders don’t need a raw data firehose. They need three bullets and a decision. Tools that generate executive-ready pages, podcasts, or video recaps save hours. For structure, check our AI-generated reports and automated reports guide.
6) Governance and reliability
Data without trust is just stress. Look for permissioning, metric definitions, and audit logs. HubSpot highlights why consistent KPIs and governance reduce confusion (HubSpot: Marketing Reporting).
7) Privacy-aware measurement
Between iOS privacy updates and cookie deprecation, your tool should play nice with modeled conversions and privacy-friendly analytics. If incrementality testing is on your roadmap, make sure your platform can handle it.
Marketing metrics to automate by channel
What belongs in your automated weekly report? Here’s a pragmatic list:
Paid search (Google Ads, Bing)
- Spend, clicks, CPC, CVR, CPA, ROAS
- Search term performance and n-gram themes
- Landing page performance by keyword intent
Paid social (Meta, LinkedIn, TikTok)
- Spend, CTR, CPM, CPA, ROAS
- Creative cohort analysis (hook rate, thumb-stop, hold)
- Age/geo skew and frequency caps
Organic (Search Console, GA4)
- Queries by intent, click-through rate, position shifts
- Page-level engagement: time on page, scroll depth, conversions
- Content decay alerts and internal linking opportunities
Email/SMS
- Open rate (modeled), CTR, conversion rate
- List growth and churn, revenue per send
- Lifecycle stage performance (welcome, reactivation, post-purchase)
Funnel and revenue
- Blended CPA, MER, CAC payback
- Pipeline velocity and opportunity conversion (if B2B)
- Returning vs new customer revenue share (if DTC)
For deeper structures, see our marketing scorecard template and KPI framework.
Automation without losing the narrative
Automation can create the illusion of clarity without actual understanding. To keep the story intact:
- Start with questions: “Where did growth come from this week?” “What changed materially?” “What will we do next?”
- Limit metrics per audience: Execs: five KPIs and a plan. Channel owners: more detail.
- Establish a reporting cadence: Weekly ops, monthly strategy, quarterly deep dives. Here’s a weekly template.
- Document definitions: If ROAS means seven-day click for paid social, write it down. Future-you will thank past-you.
- Use AI as a first draft: Then add your POV: “We’re shifting 10% from Prospecting to Remarketing due to rising CPMs.”
Common pitfalls with automation
1) Over-connecting, under-thinking
It’s tempting to wire up every source and call it done. But more data doesn’t equal more clarity. Tie every chart to a decision.
2) Last-click tunnel vision
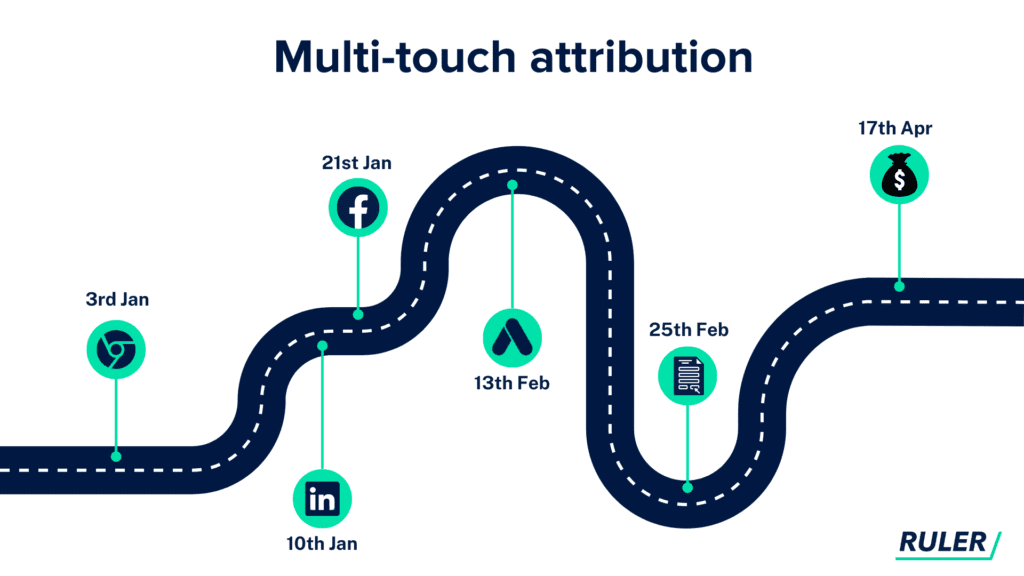
Automation often leans on the defaults. That usually means last-click attribution. Understand the tradeoffs — our piece on data-driven attribution vs last click can help. Also watch for GA4 attribution pitfalls like mismatched conversion windows.
3) Alert fatigue
If everything is an alert, nothing is. Configure thresholds and business rules so only material changes ping your team.
4) Dashboard sprawl
Multiple tools create multiple truths. Keep one source of truth and tailor views for each audience. See executive dashboard guide and dashboard examples.
How to evaluate marketing reporting automation tools (a practical playbook)
Step 1: Write your non-negotiables
Example: “Connects to GA4, Google Ads, Meta Ads, and Search Console; auto-narratives; weekly executive email; anomaly alerts; supports blended ROAS and MER; client-ready exports.”
Step 2: Run a one-week pilot
- Connect your core sources.
- Load last 90 days of data.
- Validate five KPIs against your source-of-truth.
- Send a test executive summary to stakeholders.
- Track time spent to get to “good enough.”
Step 3: Score the insight layer
Ask, “Does the tool highlight the same observations our best analyst would?” Does it spot seasonality, creative fatigue, conversion lag?
Step 4: Stress test governance
- Can you lock metric definitions?
- Are audit logs available?
- Can you restrict access by role/client?
Step 5: Estimate total cost of ownership
Include licenses, connectors, warehouse fees, and human time. A tool that saves six analyst hours per week may be “cheaper” than a lower sticker price. Harvard Business Review has a solid perspective on analytics ROI framing (HBR: competent management) — the gist: time saved on routine work drives outsized value.
When AI becomes the difference-maker
Generative AI has pushed automation from “refresh the dashboard” to “explain what happened and what to do.” According to Gartner’s definition of augmented analytics, the real unlock is helping non-analysts make confident decisions faster (Gartner).
In practice, here’s what that looks like:
- Plain-language summaries: “Paid social CTR fell 18% WoW; creative 4 fatigued after 4.1 frequency. Shift $3k to Creative 7 and retest hook copy.”
- Automatic context: “YoY growth looks down due to last year’s promotion. On a 4-week rolling basis, you’re up 12%.”
- Actionable next steps: Budget reallocation suggestions, campaign pausing logic, landing page fixes.
- New formats: Reports as podcasts or quick video briefings that actually get consumed.
Mini comparison: where tools tend to differ
Rather than a giant grid, here’s how categories typically stack up:
BI-first platforms
Strengths: Maximum flexibility; warehouse-native; enterprise governance.
Gaps: Requires data modeling; slow time-to-value; narratives are manual or add-ons.
Marketing dashboard suites
Strengths: Good connectors; purpose-built KPIs; easier setup.
Gaps: Limited AI insights; executive storytelling still manual.
AI-native reporting tools
Strengths: Automated narratives, alerts, and action suggestions; fastest way to useful weekly updates; high adoption by non-analysts.
Gaps: Less control over low-level modeling; depends on well-governed inputs.
Whichever route you take, insist on a trial that proves it saves time and produces better decisions.
Blended ROAS, incrementality, and other real-world wrinkles
Modern measurement is messy — but your reports don’t have to be.
- Blended ROAS: Calculate revenue/spend across channels to correct single-channel bias. Here’s a guide to MMM vs MTA if you’re debating approaches.
- Incrementality vs attribution: Automation should support both views. Use attribution for optimization and incrementality tests for budget strategy.
- Post-iOS privacy: Expect modeled conversions and longer feedback loops. Build patience into your reporting cadence.
A sample weekly reporting workflow (fully automated)
- Monday 7:00 a.m. — Data syncs from GA4, Google Ads, Meta, and Search Console.
- 7:05 a.m. — KPIs recalculated: MER, blended CPA, ROAS by channel, funnel conversion.
- 7:06 a.m. — Anomaly scan flags a drop in Meta conversions; frequency > 4; creative fatigue suspected.
- 7:07 a.m. — AI summary drafts a weekly TL;DR and records a 90-second audio recap.
- 8:30 a.m. — CMO reads the executive email, replies “Shift 10% from Prospecting to Retargeting, test Creative 9.”
- 9:00 a.m. — Channel leads open detailed dashboards for execution.
That’s the difference between “We have dashboards” and “We run on insights.”
Try this checklist before you buy
- Does it connect to GA4, Google Ads, Meta Ads, and Search Console out of the box?
- Can it generate weekly executive summaries you’d actually send?
- Are alerts intelligent enough to avoid false positives?
- Can it compute blended ROAS, MER, and CAC payback?
- Does it let you map campaigns and channels to a consistent taxonomy?
- Can non-technical teammates create or customize views?
- How fast can you go from empty account to useful insight?
So… which tool should you pick?
I won’t pretend there’s one answer for every stack. But if your goal is to turn noisy, cross-channel data into clear, human-sounding insights and action — without adding a new full-time job — you’ll want a solution that automates the boring parts and elevates the smart ones.
Morning Report: your AI-powered shortcut from data to decisions
Morning Report connects to GA4, Google Ads, Meta Ads, and Search Console, automatically analyzes performance trends, and delivers AI-written reports, podcasts, and video recaps that explain what happened — and what to do next. It’s like having a marketing analyst, strategist, and motivational coffee buddy in one.
- Zero-hassle setup: Connect your sources and get a useful weekly report in minutes.
- AI narratives: Clear, actionable summaries with recommendations.
- Executive-ready formats: Email, podcast, and video recaps that actually get consumed.
- Smart alerts: Anomaly detection that respects your thresholds and sanity.
- Cross-channel clarity: Unified KPIs for paid, organic, email, and revenue.
Want to see what modern marketing reporting automation tools can feel like when they’re done right? Take Morning Report for a spin and ship your next weekly update before your coffee gets cold.
Start your 14-day free trial
Sources


.svg)