AI Data Storytelling for Marketers: From Dashboards to Decisions
Ever feel like your dashboards are yelling, but your team still can’t hear the point? You open GA4, peek at Meta Ads, skim Google Ads, glance at Search Console—and after 14 tabs, you’ve got 0 stories. Just a pile of charts.
Marketing doesn’t win on charts. It wins on clarity. The fastest way to clarity? AI data storytelling for marketers: turning messy metrics into short, scannable narratives that explain what happened, why it matters, and what to do next.
This guide shows you how to build that machine—practically. We’ll cover the anatomy of a great analytics story, an AI-first workflow that runs weekly without tears, and real examples you can steal for your next exec update. If you’re spending more time formatting slides than finding insights, buckle up.
What is AI data storytelling for marketers?
AI data storytelling for marketers is the practice of using AI to turn raw marketing data into narrative insights—complete with context, visualizations, and next steps. It connects the dots across GA4, Google Ads, Meta, and Search Console, then communicates the story in formats people actually consume: reports, podcasts, and quick video recaps.
Think of it as a workflow, not a widget:
- Automated collection and cleaning of cross-channel data
- Insight detection (anomalies, trends, attribution shifts)
- Business context and benchmarking
- Narrative assembly: headline, supporting evidence, recommended actions
- Delivery to stakeholders in their preferred format—Slack, email, deck, podcast
Gartner has called data storytelling “the last mile of analytics,” because it turns analysis into action. Without the story, insights die in dashboards. With it, people move. Source: https://www.gartner.com/en/newsroom/press-releases/2020-02-05-gartner-says-data-literacy-becomes-a-core-driver-of-business-value
Why marketers need stories (not just dashboards)
Executives make decisions under pressure and uncertainty. They don’t need every metric—they need the meaning. Good stories reduce cognitive load and increase actionability.
- Faster decision-making: The human brain processes stories better than tables. HBR notes that the right visual and framing accelerates understanding and persuasion. Source: https://hbr.org/2013/04/when-choosing-a-chart-first-ask-what-you-want-to-show
- Cross-functional alignment: Sales, product, and finance don’t speak “last non-direct click.” They speak “what changed, why, and what now.”
- Time recovery: Automation handles the 80% grunt work (blending metrics, charting, copy drafting) so analysts spend more time validating insights.
- Consistency: Weekly narrative beats keep leadership focused on the same KPIs and hypotheses.
If you want template inspiration, see our related guides:
The anatomy of a marketing analytics story
All good stories follow a simple arc. So should your analytics.
1) Headline
Make it tweetable. Example: “Paid Social CPA rose 18% WoW—creative fatigue hit our top ad set.”
2) What happened
Show the pattern concisely: trend line, percent change, timeframe, segments.
3) Why it happened
Hypotheses supported by data: audience overlap, creative fatigue, budget pacing, seasonality, macro trends.
4) What to do next
Specific, prioritized actions with expected impact. Tie to cost or revenue outcomes.
5) What to watch
Leading indicators and an alert threshold (e.g., “flag if CPA > $65 for 2 days”).
In one slide, one paragraph, or a 30-second audio clip—you’ve told the story.
An AI-first workflow for weekly reporting
Let’s turn that arc into a repeatable system that runs every week without you playing spreadsheet Jenga.
Step 1: Centralize data
- Connect GA4, Google Ads, Meta Ads, and Search Console.
- Standardize UTM and channel naming. Map “Paid Search”/“SEM”/“Google CPC” to your canonical channels.
- Create a centralized marketing data hub to avoid one-off CSV chaos.
Tip: GA4 anomaly detection can anchor your weekly scan for “what changed?” before you go hunting. Source: https://support.google.com/analytics/answer/10447262
Step 2: Automated insight generation
- Run detection for spikes, dips, and segmentation breakouts (device, geo, audience, creative).
- Benchmark against prior period and prior year; normalize for seasonality.
- Flag attribution shifts and conversion modeling changes, especially if you rely on GA4 mode-led conversions.
Related reading: GA4 Anomaly Detection Guide and Data-Driven Attribution vs. Last Click.
Step 3: Assemble the narrative
- Draft headlines and insights grouped by business question: growth, efficiency, pipeline quality.
- Summarize each channel’s big 3: volume, efficiency, and quality (e.g., leads, CPA/ROAS, conversion rate/LTV).
- Translate into stakeholder-friendly language. Avoid acronyms unless your audience lives in them.
Step 4: Visuals that actually communicate
Step 5: Deliver in human formats
- Podcast-style analytics reports for on-the-go stakeholders.
- TL;DR email with 3 bullets and a chart.
- 1-slide executive summary for the Monday standup.
Related: AI Summaries for Marketing Analytics and AI-Generated Marketing Reports.
Key use cases (steal these story outlines)
1) Weekly executive summary
Audience: CEO, CMO, finance. Format: 1 slide + 60-second audio.
- Headline: “Revenue +7% WoW; Paid Search drove 62% of incremental revenue.”
- What happened: “Branded CPCs dropped 9%; CTR +15%. ROAS 5.2 vs 4.6.”
- Why: “New ad copy and sitelinks improved CTR; competitor share declined.”
- Action: “Increase branded budget cap +10% this week; test RSAs variant B on top queries.”
2) Campaign post-mortem
Audience: growth team. Format: deck + appendix.
- Headline: “Q3 Launch under-delivered MQLs (−12%) but improved SQL rate to 38%.”
- Why: “Tighter targeting reduced top-of-funnel volume; higher intent boosted down-funnel.”
- Action: “Spin a TOFU variant with broader audience; keep high-intent segment; adjust creative to reduce CPA.”
3) Anomaly explainer
Audience: business stakeholders. Format: short memo.
- Headline: “CPA spike +24% MoM from creative fatigue and audience overlap.”
- Evidence: “Ad frequency > 4.2; overlap 36% with prospecting; CTR fell 22%.”
- Action: “Refresh top 3 creatives; exclude 5% overlap; test new hook; set automated KPI alerts for CPA > $65.”
4) Board update
Audience: board, finance. Format: 5-slide story with MMM and incrementality callouts.
- Headline: “Revenue beat plan +4%; MMM indicates Paid Social contributed 18% of assisted sales.”
- Why: “Incrementality tests show blended uplift; spend reallocation improved marginal ROAS.”
- Action: “Shift 8% budget from low-return placements; invest in creative testing; monitor seasonality-driven ROAS forecasts.”
Choosing metrics that make stories stick
Most dashboards drown stakeholders in vanity metrics. Your narrative should focus on decision-driving KPIs. If you need a framework, check out our Marketing KPI Framework and these Marketing Dashboard Examples.
North-star metrics
- Pipeline/revenue: revenue, LTV, SQLs, opportunities
- Efficiency: CPA, ROAS, CAC payback
- Quality: conversion rate, lead-to-SQL, SQO rate
Channel-level essentials
- Paid Search: search impression share, query mix, ROAS, CPA, budget pacing; see examples and cross-channel dashboards.
- Paid Social: frequency, creative fatigue indicators, view-through contribution, incrementality test results
- SEO: clicks, impressions, CTR, top queries (Search Console), content category performance; try Data Visualization for Marketers.
Context and benchmarks
Your story needs a yardstick. Show change vs last week, last quarter, and industry benchmarks when available. HubSpot’s benchmark posts are handy references. Source: https://blog.hubspot.com/marketing/marketing-benchmarks
How AI builds the story for you
Here’s where AI shines in ai data storytelling for marketers:
- Pattern detection: find anomalies, cohort shifts, diminishing returns, and creative fatigue before humans notice.
- Attribution reasoning: reconcile GA4’s modeled conversions with platform-reported conversions; suggest privacy-friendly attribution methods as cookies fade.
- Narrative drafting: write headlines, executive summaries, and next-step suggestions tailored to your KPIs and audience.
- Multimodal delivery: generate audio “morning briefings” or short video explainers for leaders who won’t open Slides.
Combine this with automated KPI alerts and you have a system that surfaces change, explains it, and tells people what to do—all before your first coffee.
A practical, repeatable weekly cadence
Consistency beats intensity. Adopt a simple reporting heartbeat:
- Monday morning: 60-second podcast-style recap + 1-slide TL;DR
- Tuesday: dive into anomalies and run follow-up experiments
- Thursday: creative and audience testing update
- End of month: synthesis, budget recommendations, and forecast update
If you’re formalizing this for your team or clients, see Weekly Marketing Report Template and Client Reporting for Marketing Agencies.
Examples: Stories your execs will actually read
Story: We’re paying a premium for weekends
Headline: “Weekend CPA +32% vs weekdays—shift budget to weekdays for +14% more conversions at same spend.”
What happened: “Across Paid Social and Search, CPA spikes Saturday–Sunday; CTR dips; CPC up due to auction pressure.”
Why: “Lower intent on weekends, competitive auctions, and broad creative targeting.”
Action: “Cap weekend spend at 15%; schedule weekday-heavy delivery; test weekend-only creative with promo CTA.”
Story: Branded search is doing heavy lifting
Headline: “Branded Search drove 54% of last week’s incremental conversions; non-brand spend over-indexed on low-intent terms.”
Action: “Protect brand terms (target IS > 90%); re-allocate 12% from low-return generic keywords to high-intent segments; test RSAs with benefit-led copy.”
Story: Creative fatigue is real
Headline: “Top Meta ad frequency > 3.8; CTR −21% WoW; CPA +17%.”
Action: “Rotate 3 new creatives; introduce thumb-stopping hooks; set automated KPI alerts for frequency > 3.5.”
Build your AI data storytelling stack
You don’t need a dozen tools. You need a small, reliable stack that automates the boring and amplifies the important.
Data layer
- GA4 as your web/app source of truth for onsite behavior
- Platform APIs (Google Ads, Meta Ads) for spend and campaign metadata
- Search Console for organic queries and CTR
Insight layer
- Anomaly detection and segmentation analysis
- Attribution sanity checks (data-driven vs last click) and MMM where scale allows
- Forecasting with seasonal adjustments for ROAS and CPA
Story layer
- Narrative generation tailored to audience personas
- Visuals with annotation-first design
- Distribution: email, Slack, podcast-style audio, video recaps
For a deep-dive on tools and approaches, see our Marketing Reporting Automation Tools Guide and Marketing Intelligence Platforms Buyer’s Guide.
Guardrails, ethics, and trust
AI can confidently tell the wrong story if you’re not careful. Put guardrails in place:
- Source-of-truth tagging: note whether a metric is GA4-modeled, platform-reported, or modeled via MMM.
- Confidence annotations: “High confidence: 4-week trend with stable spend” vs “Low confidence: 1-day spike after tracking change.”
- Attribution transparency: explain why data-driven attribution differs from last click; link to the methodology. See MMM vs MTA and Marketing Forecasting Methods.
- Privacy-first design: lean on privacy-friendly attribution methods and incrementality tests as third-party cookies fade.
A 7-part template to operationalize AI storytelling
- Define audiences: Exec, Growth, Channel Owners
- Pick KPIs: revenue, ROAS/CPA, pipeline quality
- Connect sources: GA4, Google Ads, Meta, Search Console
- Automate anomaly detection with thresholds and alerts
- Draft the story: headline, what/why, recommended actions
- Visualize with one insight per chart and clear annotations
- Deliver via email + podcast-style recap; log actions for follow-up
Want concrete dashboard structure ideas? See Cross-Channel Marketing Dashboard Guide and Marketing Dashboard Examples.
Common pitfalls (and fixes)
- Too many metrics: ruthlessly prune. One story per slide.
- Jargon overload: translate “heteroscedasticity” to “variance is weird this week.”
- No action: every story needs a recommended test or budget shift.
- Cherry-picking: show both the win and the tradeoff (e.g., CPA down, volume down too).
- Static cadence: business seasons change—so should thresholds and goals.
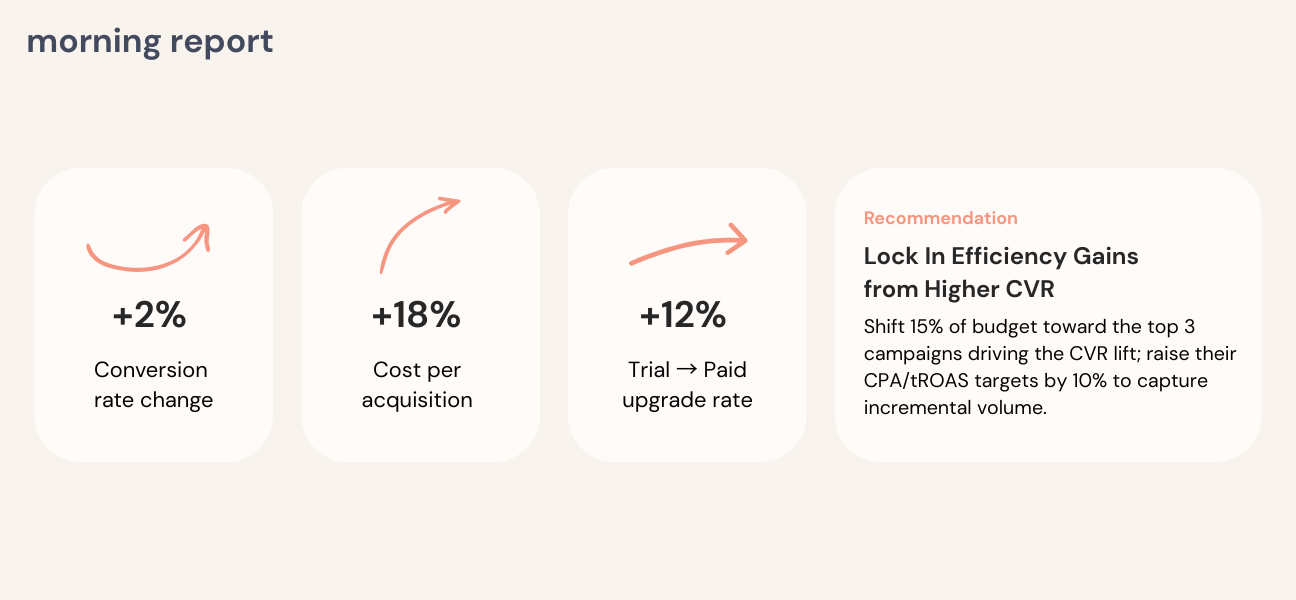
How Morning Report helps
Morning Report is built for ai data storytelling for marketers. It connects GA4, Google Ads, Meta Ads, and Search Console, automatically analyzes performance trends, and delivers AI-written summaries you can actually act on. It also generates podcast-style recaps and short video explainers for leaders who will never open a Looker dashboard.
Here’s what it does out of the box:
- Automated insight generation across channels (with anomaly detection)
- Executive-ready narratives with benchmarks and confidence notes
- Action recommendations tied to KPIs and budgets
- Podcast and video recaps for busy stakeholders
- Automated KPI alerts so you get signal before the fire drill
Bottom line: fewer tabs, faster decisions, and a team that knows what to do Monday morning.
Bring your data to life
Dashboards are necessary. Stories are inevitable. If your team needs faster answers, clearer decisions, and fewer meetings that feel like a metric maze, ai data storytelling for marketers is your lever.
Let Morning Report be your marketing analyst, strategist, and motivational coffee buddy—rolled into one. Turn your data into decisions in minutes, not meetings.
Try Morning Report free for 14 days at https://app.morningreport.io/sign_up.
Sources


.svg)


.png)